ELIAS
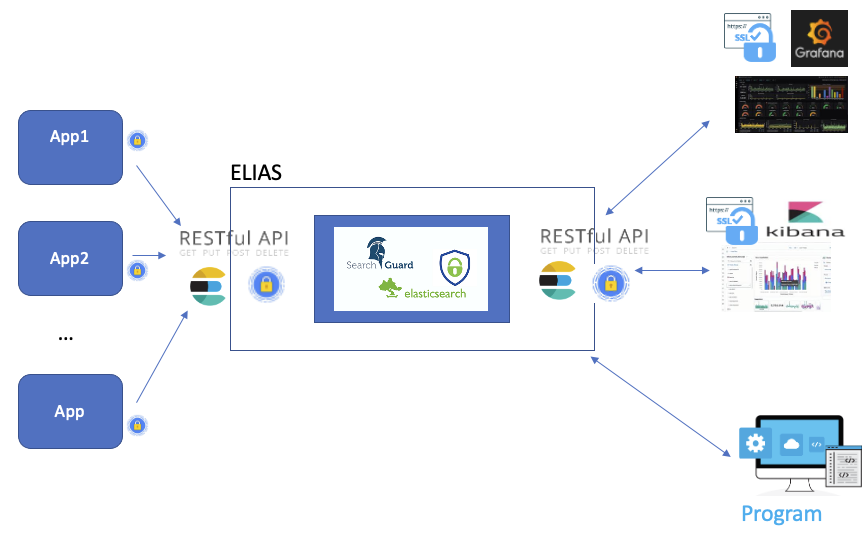
ELIAS is the CC-IN2P3 Elasticsearch service. It will allow you to optimize your text searches via Elasticsearch and visualize them as graphs organized in dashboards using Kibana and Grafana tools. A REST API is also available.

Following the platform usage, different types of hosting are available:
a generic shared cluster,
a cluster adapted to specific needs.
To request access, please contact user support. If you have a particular need, please specify it in your request (context, reason and resource request) as for database requests.
You will then be assigned a namespace on ELIAS, along with the rights to associating one or more access accounts (human or robot) to it.
Note
The access URL to your ELIAS cluster will have the following syntax:
elias-${CLUSTERNAME}.cc.in2p3.fr
The $CLUSTERNAME variable depends on the cluster on which the user is hosted. The value of this variable will be given to the user along with their credentials.
Access the platform
All the services in ELIAS rely on a centralized authentication system and support several methods according to the account type.
Account types
An account (user or robot) is associated with one or more authentication methods and has a set of privileges.
User accounts will be identified by:
Kerberos,
Keycloack,
login / password.
Robot accounts will be identified by:
client certificate,
login / password.
A good practice is to associate, whenever possible, one robot account per client machine. For security reasons, we recommend the use of specific accounts for all machines outside CC-IN2P3.
Access methods
This method is recommended for interactive use, for example:
session on your workstation,
linux session on an interactive server.
To be able to use Kerberos authentication, all you need is a computing-account, and to have it correctly configured.
After a simple request (a curl, for example):
% curl --negotiate -u: https://elias-elias-${CLUSTERNAME}.cc.in2p3.fr.cc.in2p3.fr:9200/
the Kerberos tickets list should look like:
% klist
Ticket cache: FILE:/tmp/krb5cc_1234_RrLMgX8bak
Default principal: username@CC.IN2P3.FR

Valid starting       Expires              Service principal
05/12/2020 10:49:33  05/15/2020 09:07:56  krbtgt/CC.IN2P3.FR@CC.IN2P3.FR
05/12/2020 10:50:30  05/15/2020 09:07:56  HTTP/ccosvmse0007.in2p3.fr@
05/12/2020 10:50:30  05/15/2020 09:07:56  HTTP/ccosvmse0007.in2p3.fr@CC.IN2P3.FR
The machine appearing as the main service HTTP/... corresponds to the ELIAS service entry point.
This method is recommended for the access to Kibana / Grafana and is based on the CC-IN2P3 authentication system. To benefit from this authentication method, all you need is a computing-account.
Certificates are used to authenticate and to secure exchanges between client and server. This method is recommended for automated interactions such as:
Scheduled task (cron),
Job in the compute farm,
Data import (DAQ).
The ELIAS platform has its own certification authority therefore you will need to download the CA-ELIAS bundle and import it into your operating system, browser or application.
To request access by certificate, please follow the procedure depending on your operating system. The procedure is to be applied on the target machine, i.e. the machine that will use the certificate. It must not be used on any other machine.
Generate rsa private key
% openssl genrsa -out myelias.key 2048
Generate the CSR (Certificate Signing Request):
% openssl req -new -key ${ROBOT}.key -out ${ROBOT}.csr

You are about to be asked to enter information that will be incorporated
into your certificate request.
What you are about to enter is what is called a Distinguished Name or a DN.
There are quite a few fields but you can leave some blank
For some fields there will be a default value,
If you enter '.', the field will be left blank.
-----
Country Name (2 letter code) [AU]:FR
State or Province Name (full name) [Some-State]:RHONE
Locality Name (eg, city) []:London
Organization Name (eg, company) [Internet Widgits Pty Ltd]:CNRS
Organizational Unit Name (eg, section) []:CC-IN2P3
Common Name (e.g. server FQDN or YOUR name) []: <ELIAS account>
Email Address []:
Please enter the following 'extra' attributes
to be sent with your certificate request
A challenge password []:
An optional company name []:
Attention
To ease the user management, we recommend to respect the following rules for the Subject key:
<ELIAS account> = <namespace> + <machine> + <application name>
If you want to use the certificate for several machines use the following pattern:
<ELIAS account> = <namespace> + <application name>
For the OR, O and C fields these are optional and can be personalized without constraint
Send the output file with the
.reqextension to eliasmaster@cc.in2p3.fr.Attention
Never send the
${ROBOT}.keyby email. The key must never travel through the network and remain on the machine on which it was generated.Your certificate will be sent to you by email.
From your powershell check that the
certreq.execommand is available.Create a
request.inffile with the following information:
[Version]
Signature= "$Windows NT$"
[NewRequest]
Subject = "CN=<ELIAS account>, OU=IN2P3, O=CNRS, C=FR"
KeySpec = 1
KeyLength = 4096
Exportable = TRUE
MachineKeySet = TRUE
SMIME=False
PrivateKeyArchive = FALSE
UserProtected = FALSE
UseExistingKeySet = FALSE
ProviderName = "Microsoft RSA SChannel Cryptographic Provider"
ProviderType = 12
RequestType = PKCS10
KeyUsage = 0xa0
[EnhancedKeyUsageExtension]
OID=1.3.6.1.5.5.7.3.2
Attention
To ease the user management, we recommend to respect the following rules for the Subject key:
<ELIAS account> = <namespace> + <machine> + <application name>
If you want to use the certificate for several machines use the following pattern:
<ELIAS account> = <namespace> + <application name>
For the OR, O and C fields these are optional and can be personalized without constraint
Generate a certificate signing request
certreq.exe -New request.inf ${ROBOT}.req
Send the file
${ROBOT}.reqto eliasmaster@cc.in2p3.fr .Your certificate signed by the CA will then be sent to you by email.
Attention
It is strongly recommended to avoid this type of authentication for security reasons.
We recommend you use the following syntax for login (<username>):
<username> = <namespace> + <application name>
Services included in ELIAS
The REST API is an interface for exchanging data between web services. As an API client, you’ll use HTTP calls (GET, POST, PUT, …). To access the REST API, you’ll need to authenticate using one of the following methods:
For more information, check the following paragraphs:
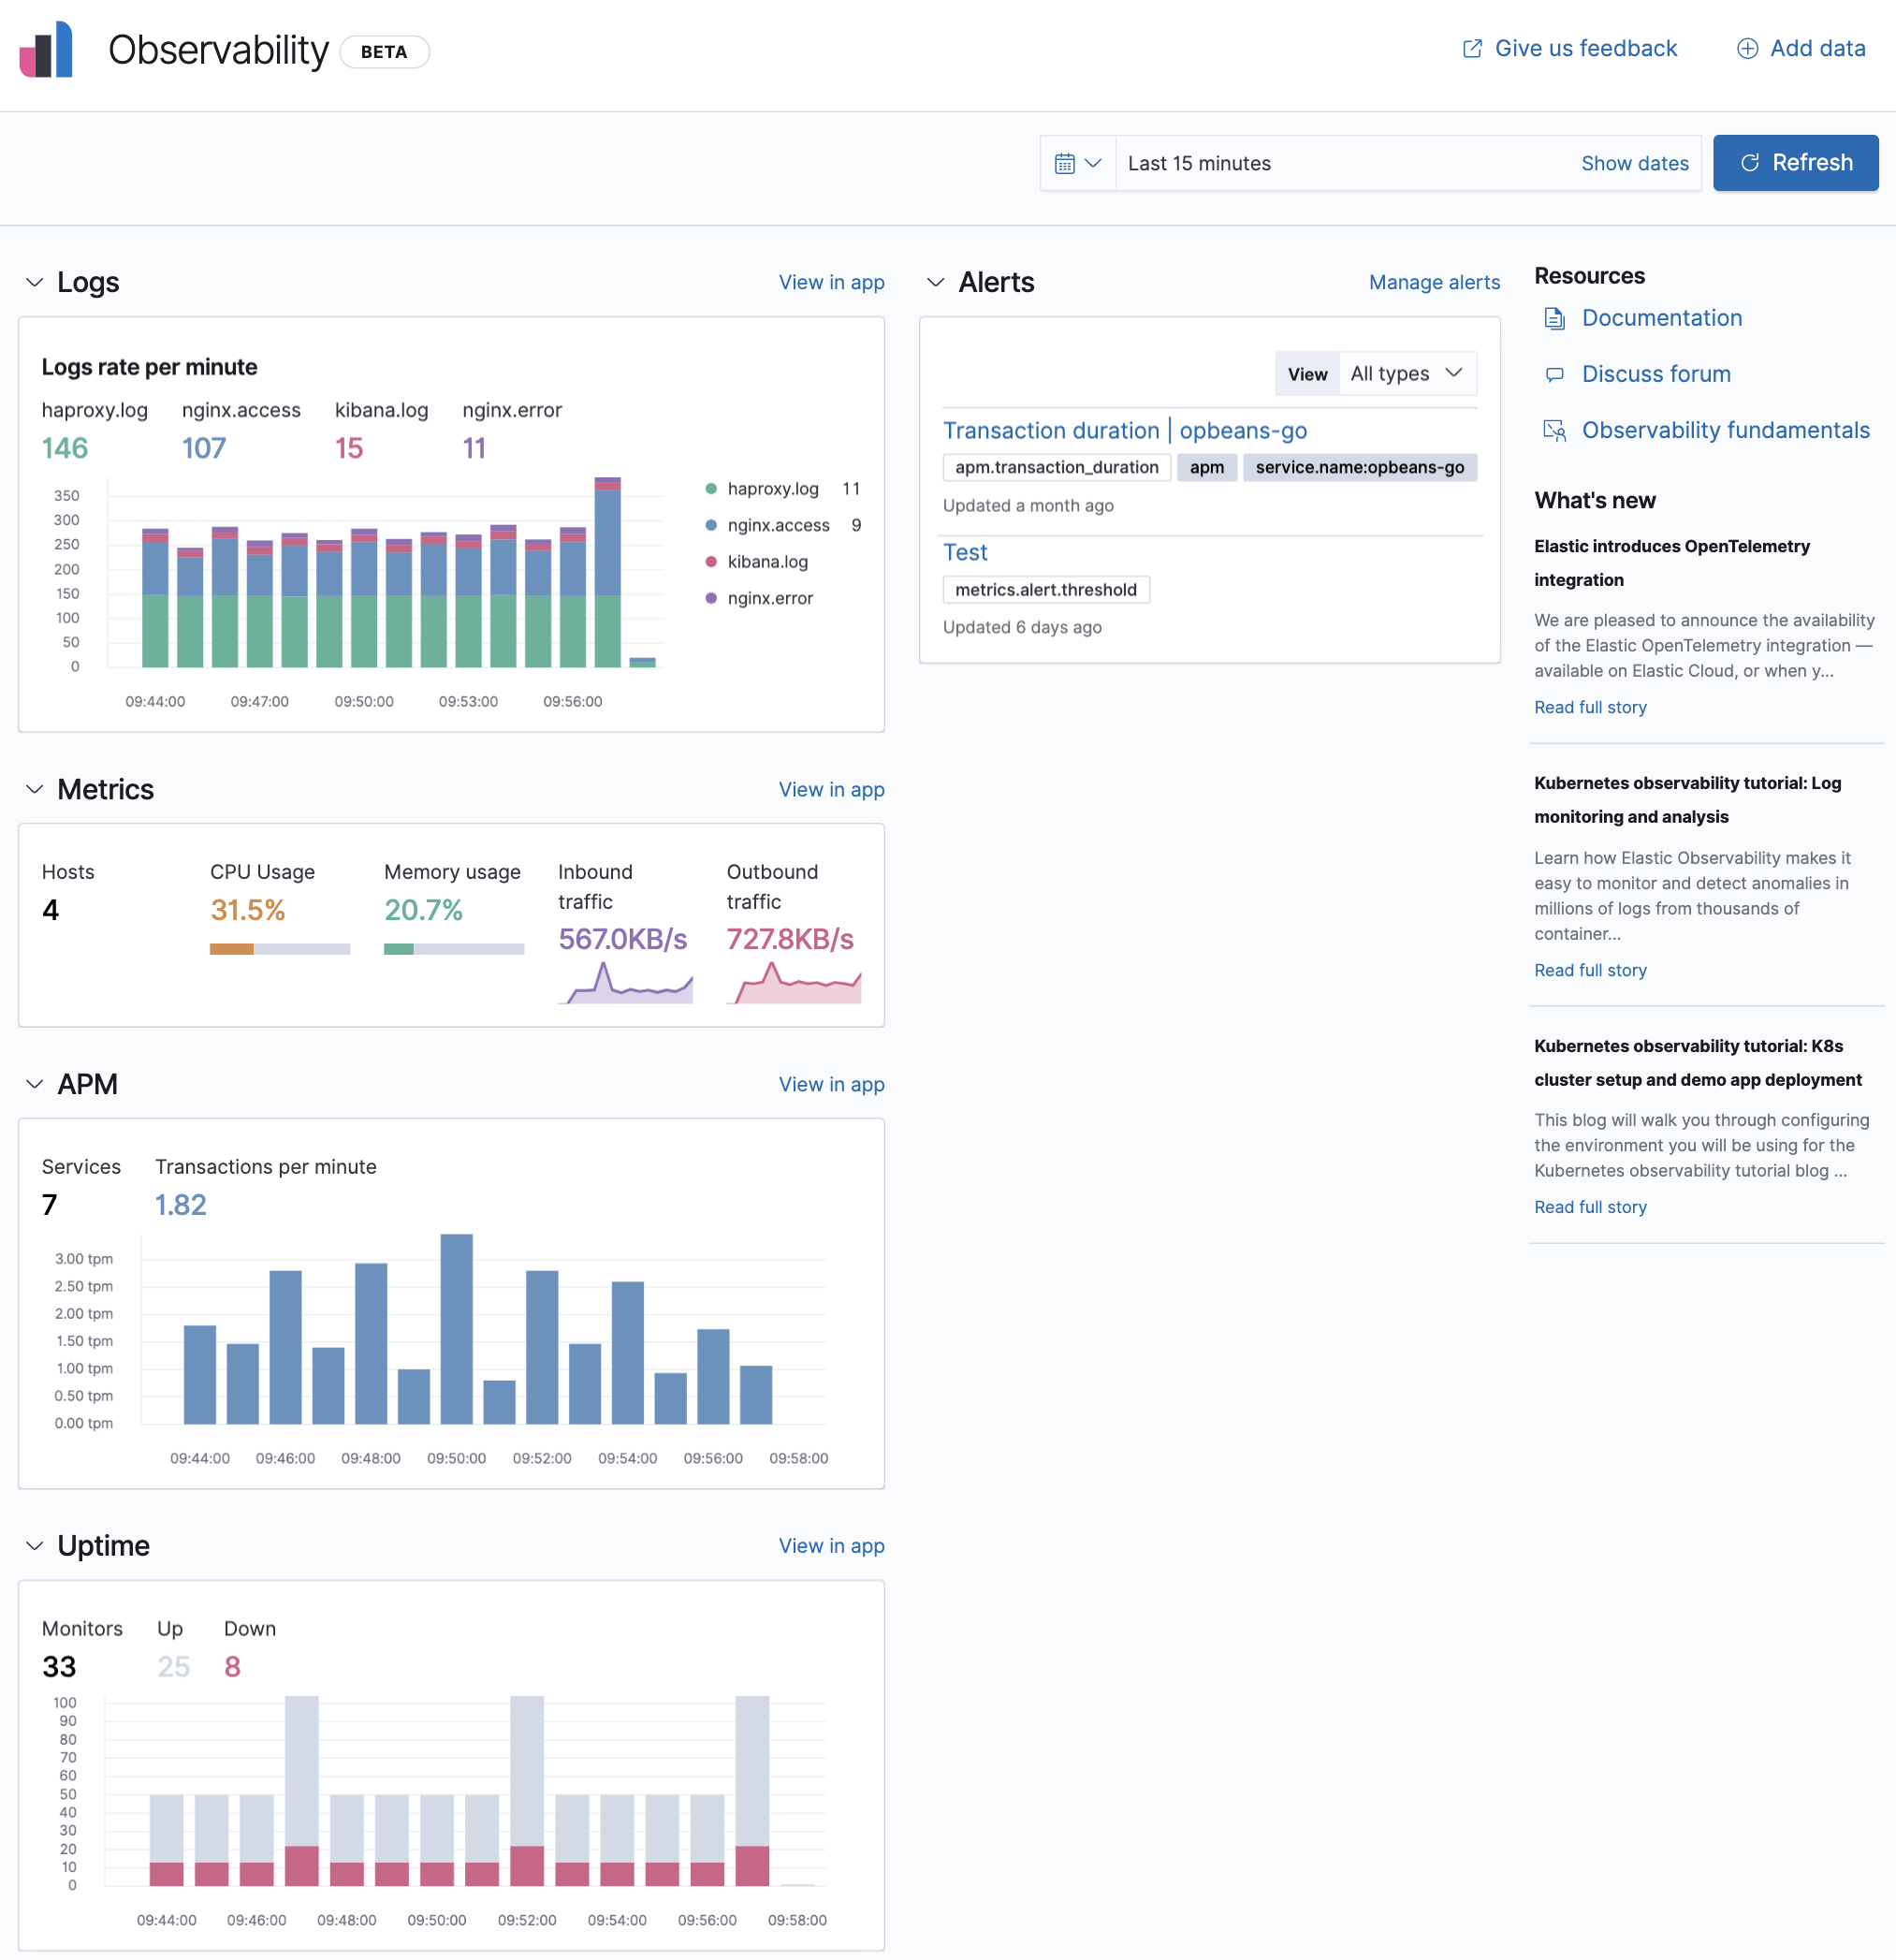
Kibana is a graphical user interface well suited to analyzing textual data (log files, for example). You can build graphs based on a text search to build your own dashboard. To access Kibana you must have a computing account.
As an ELIAS users you will find your Kibana service at the following URL:
elias-${CLUSTERNAME}.cc.in2p3.fr
The $CLUSTERNAME variable will depend on the cluster on which you will be hosted.
Grafana is a graphical user interface best suited for the analysis of numerical data in time series. Grafana uses dashboards to arrange a set of metrics on the same page. To access Grafana you must have a computing account.
As an ELIAS users you will find your Grafana service at the following URL:
elias-${CLUSTERNAME}.cc.in2p3.fr:4443/
The $CLUSTERNAME variable will depend on the cluster on which you will be hosted.
Data ingestion in ELIAS
The ingestion of your data into ELIAS is only possible through the REST API.
The REST API can be leveraged by high-level libraries, some of which are maintained by elastic.co, or through command line tools like curl, wget, httpie, …
To store your data in ELIAS, three approaches are possible:
command line tools (
curl) (practical for a first grip),dedicated agent (Fluentbit, logstash, syslog-ng, …),
your own scripts using high-level libraries.
To specify the authentication method you can use the following options:
% kinit
% curl -u: --negotiate --cacert /path/to/elias.ca -H 'Content-Type: application/json' ...
% curl --key /path/to/mycertificate.pkey --cert /path/to/mycertificate.crt --cacert /path/to/elias.ca -H 'Content-Type: application/json' ...
% curl -u mylogin:mypwd --cacert /path/to/elias.ca -H 'Content-Type: application/json' ...
Elasticsearch stores data in an index that can be compared to a table in relational databases. The following command connects via a certificate to ELIAS and creates an index named mynamespace-myindexname.
% curl -XPUT 'https://elias-${CLUSTERNAME}.cc.in2p3.fr:9200/mynamespace-myindexname?pretty' --key /path/to/mycertificate.pkey --cert /path/to/mycertificate.crt --cacert /path/to/elias.ca -H 'Content-Type: application/json'
Attention
The index name must respect the following syntax: <namespace>-<index>. You can create as many indexes as you want under your ELIAS space.
The name of the namespace is imposed by the ELIAS administrators and is communicated to you when creating your account.
An Elasticsearch index only manipulates JSON documents. A document is a collection of key/value tuples and it is the smallest unit that Elasticsearch manages. It is possible to store documents with completely heterogeneous data structures (under certain conditions).
Elasticsearch builds the schema as the documents arrive. However, it is possible to impose an explicit data structure by configuring the mapping.
The following example associates a minimal structure that the documents in the index mynamespace-myindexname must respect.
% curl -XPUT --key /path/to/mycertificate.pkey --cert /path/to/mycertificate.crt --cacert  /path/to/elias.ca -H 'Content-type: application/json' -XPUT 'http://localhost:9200/test3/_mapping' -d
'{
      "dynamic_templates": [
        {
          "template_stdField": {
            "path_match": "*",
            "mapping": {
              "ignore_malformed": true,
              "type": "keyword"
            }
          }
        }
      ],
      "properties": {
        "user_name": {
          "type": "text"
        }
      }
  }'
The following command defines an explicit mapping for the index mynamespace-myindexname.
% curl -XPUT --key /path/to/mycertificate.pkey --cert /path/to/mycertificate.crt --cacert /path/to/elias.ca -H 'Content-Type: application/json' 'https://elias-${CLUSTERNAME}.cc.in2p3.fr:9200/mynamespace-myindexname/_mapping' -d @"my_mapping.json"
my_mapping.json file content{
"dynamic_templates": [
{ -
"template_stdField": {
"path_match": "*",
"mapping": {
"ignore_malformed": true,
"type": "keyword"
}
}
}
],
"properties": {
"user_name": {
"type": "text"
}
}
}
Attention
Explicit mapping can reject nonconforming documents with the ignore-malformed option.
Note
For more information on mapping, please refer to the official documentation.
The following command connects to ELIAS by certificate and creates a first document in the kafka-testoal index:
% curl -XPOST 'https://elias-${CLUSTERNAME}.cc.in2p3.fr:9200/kafka-testoal/_doc/1/_create' --key /path/to/mycertificate.pkey --cert /path/to/mycertificate.crt --cacert /path/to/elias.ca -H 'Content-Type: application/json' -d '{ "user_name" : "John Doe" }'
To get a sample of the documents contained in an index, one can use the following command:
% curl -XGET 'https://elias-${CLUSTERNAME}.cc.in2p3.fr:9200/kafka-testoal//_search?pretty' --key /path/to/mycertificate.pkey --cert /path/to/mycertificate.crt --cacert /path/to/elias.ca -H 'Content-Type: application/json'
Note
In the case of an advanced search, please refer to the paragraph Consult your data.
An agent is a program collecting information from different sources and redirecting its flow to a destination of your choice.
The different data sources and the destination will have to be configured at the agent level after its installation.
Example with Fluentd agent

Agents natively integrate a set of features for processing your best-known data sources and destinations.
As for the redirection of the flow of information, all you have to do is specify ELIAS as the destination.
There is a multitude of proprietary and opensource agents, such as
Agent support is not provided by the service administrators. For an easy and quick installation we advise you to check Fluentbit.
For more information, check the Supervise your machine paragraph.
If you have developed your own application or you have specific needs that cannot be met with an agent, you may interface with ELIAS either by using a high-level library specific to your language (recommended), or directly via HTTP calls through the API.
The official site provides a non-exhaustive list of libraries.
The example below illustrates a python script which connects by certificate and interacts with the platform. Make sure you use a virtual environment in order to safeguard your system’s python.
Once the virtual environment
<venv>has been created and activated, install the official Elasticsearch library:% pip install elasticsearch==7.10 certifi
Use the
certifilibrary to locate the location of authorized CAs for python:>>> certified import >>> certificate.where() '/<path>/<venv>/lib/python3.9/site-packages/certifi/cacert.pem'
Append the CA-ELIAS bundle into the
cacert.pemfile:% cat elias.ca >> /<path>/<venv>/lib/python3.9/site-packages/certifi/cacert.pem
You can now authenticate by certificate with python.
Below are some instructions for getting started with ELIAS:
#!/usr/bin/env python3
from elasticsearch import Elasticsearch
from datetime import datetime
certified import

es = Elasticsearch('https://elias-${CLUSTERNAME}.cc.in2p3.fr:9200', timeout=120, use_ssl=True, verify_certs=True, client_cert='/<path>/elias/<namespace>-<host>-<username>.crt',ca_certs=certifi.where(),client_key='/<path>/elias/<namespace>-<host>-<username>.pkey')

## Display cluster status
es.cluster.health()

## Creation of an index respecting the nomenclature <namespace>-<index>
es.indices.create(index='mynamespace-myindexname')

## Checking index mapping
## The index has a dynamic mapping,
## The Elasticsearch engine describes the documents structure as they are inserted

current_mapping = es.indices.get_mapping('mynamespace-myindexname')
print(current_mapping)


## Inserting a document into an index

mydoc1 = {
    'message': 'ERROR: This message contains some data about my application',
    'IP': "192.168.56.152",
    'client': "java"
}

mydoc2 = {
    'message': 'CRITICAL: This message is a warning from my application ',
    'IP': "192.168.56.201",
    'client': "python"
}

myindexeddoc = es.index(index="mynamespace-myindexname",id="2022-08-09 16:39:11.052116",body=mydoc1)
myindexeddoc = es.index(index="mynamespace-myindexname",id="2022-08-10 17:49:11.058455",body=mydoc2)


## The mapping is automatically updated

current_mapping = es.indices.get_mapping('mynamespace-myindexname')
print(current_mapping)

## list all of your indices in your namespace

indices_dict = es.indices.get_alias("mynamespace-*")
for index_name, value in indices_dict.items():
    print('index:', index_name)


## Find a document by its identifier

print(es.get(index="mynamespace-myindexname", id="2022-08-09 16:39:11.052116"))

## Find a document with conditions

research = {
  "query": {
    "term": {
      "message": "application"
    }
  }
}

resp = es.search(body=research ,index="mynamespace-myindexname")
print(resp)

## Limit data projection

resp = es.search(body=research, index="mynamespace-myindexname",filter_path=['hits.hits._id', 'hits.hits._source.message'])


## Delete an index

es.indices.delete(index="mynamespace-myindexname")
View your data
To consult your data, ELIAS offers different interfaces according to your needs:
With Elasticsearch you may carry out exact searches using filters or fuzzy searches where the criteria can be completely or partially respected.
Example:
searches for documents that must contain the words application and contains.
% curl -GET --key /path/to/mycertificate.pkey --cert /path/to/mycertificate.crt --cacert /path/to/elias.ca -H 'Content-Type: application/json' 'https://elias-${CLUSTERNAME}.cc.in2p3.fr:9200/mynamespace-myindexname/_search' -d @"filter_query.json"
filter_query.json content{
"query": {"bool": {
"must": [
{ "match": { "message": "application" }},
{ "match": { "message": "contains" }}
]
}
}
}
searches for documents that must contain the words application and contains and potentially the word warning.
% curl -GET --key /path/to/mycertificate.pkey --cert /path/to/mycertificate.crt --cacert /path/to/elias.ca -H 'Content-Type: application/json' 'https://elias-${CLUSTERNAME}.cc.in2p3.fr:9200/mynamespace-myindexname/_search' -d @"filter_query.json"
filter_query.json content{
"query": {
"bool": {
"must": [
{ "match": { "message": "application" }},
{ "match": { "message": "contains" }}
],
"should": [
{ "match": { "message": "warning" }}
]
}
}
}
Elasticsearch implements a query language known as Elasticsearch DSL (Domain Specific Language). This language allows to express queries with complex conditions using logical, comparison and set operators.
For more details on this language, see the Elasticsearch-dsl documentation.
Please find in the following link some advanced search examples
Note
The slicing and filtering algorithm in Elasticsearch is customizable for each key. All you have to do is define the mapping appropriately.
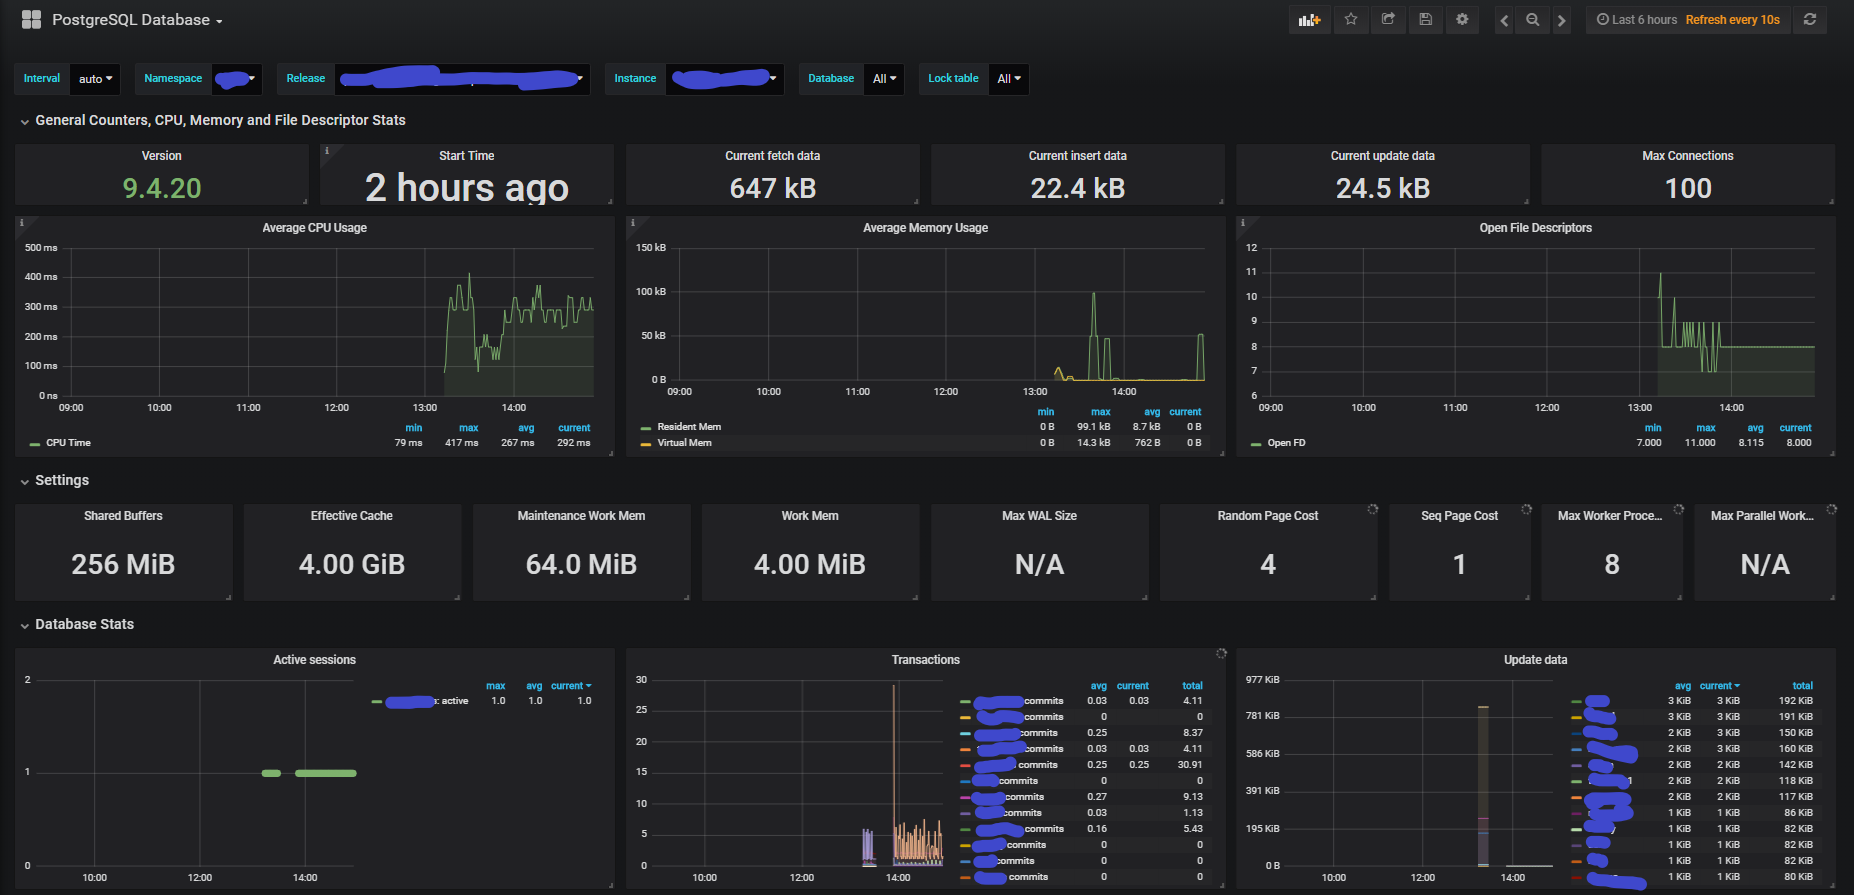
Grafana offers performance dashboards templates for monitoring well-known applications such as nginx, redis and many others.
Example of a Grafana dashboard:

Supervise your machine
To monitor your machines you can collect various metrics and logs using respectively:
Collectd, a tool allowing to collect various metrics,
Fluentbit, a lightweight tool for log management.
Data can then be sent by FluentBit to Elasticsearch to visualize them as shown in the diagram below:

Attention
You are responsible for the data you insert into Elasticsearch. Please make sure you have defined the life cycle of your data beforehand.
It is also advisable to create several indices. For example in the use case defined in this documentation it is necessary to create Collectd and FluentBit indices.
Installation
The installation procedure depends on your operating system so you will have to consult Collectd installation documentation and choose the appropriate method.
The installation procedure depends on your operating system so you will have to consult Fluentbit installation documentation and choose the appropriate method.
Configuration
For our example we will use collectd plugins installed by default at installation time.
In order to deploy a collectd plugin, you need to create a configuration file like this in /etc/collectd/plugins.
To use the memory plugin for example, we will create the file /etc/collectd/plugins/memory.conf with the following content:
<Plugin "memory">
ValuesAbsolute true
ValuesPercentage true
</Plugin>
and the configuration file for the network plugin /etc/collectd/plugin/network.conf with the following content:
<Plugin "network">
Server "127.0.0.1" "25826"
</Plugin>
We will redirect the output of the memory plugin to the localhost address on the default port which is 25826.
Next we will check that the lines LoadPlugin memory and LoadPlugin network are present in the file /etc/collectd/collectd.conf.
Then we start the service:
% sudo systemctl restart collectd.service
To check that everything went well we can check the logs with the command:
% journalctl -xe
Finally, to test that the data is exposed on the chosen port we can run the following command:
% nc -ul 25826
There are 4 FluentBit configuration sections: SERVICE, INPUT, FILTER and OUPUT
Data are processed in a pipeline like this:

For more information you can consult the following documentation: https://docs.fluentbit.io/manual/administration/configuring-fluent-bit/classic-mode/configuration-file
The main configuration file can be found here:
/etc/fluent-bit/fluent-bit.conf
It is possible to create several configuration files and include them in the main file by adding the line:
@INCLUDE myConfFile.conf
To test your configuration files you can use the visualization tool Calyptia.
Example of a configuration with the tail input which works like the tail -f command to read the end of a file and an input which will retrieve the data generated by Collectd:
# This section define various parameters for FluentBit
[SERVICE]
    flush           1
    daemon          Off
    log_level       debug
    log_file        /var/log/fluent-bit.log
    parsers_file    parsers.conf
    plugins_file    plugins.conf
    http_server     Off
    http_listen     0.0.0.0
    http_port       2020
    storage.metrics on

# This section define the input data
[INPUT]
    Name        tail
    Tag         zeppelin.log
    Path        /path/to/my/logfile/zeppelin.log
    Parser       zeppelin

# The filter field allows you to filter data using various modules like here modify which allows you to add the name of the service to the data
[FILTER]
    Name modify
    Match zeppelin.log
    Add service zeppelin

# The ouput section define the destination of data
[OUTPUT]
    Name   stdout
    Match  *

[OUTPUT]
    Name  es
    Match *.log
    Host  elias-beta.cc.in2p3.fr
    Port  9200
    Index indexname
    tls On
    tls.verify Off
    tls.ca_file      /path/to/ca.crt
    tls.crt_file     /path/to/client.crt
    tls.key_file     /path/to/client.key

# The @INCLUDE command allows you to include the content of another configuration file
@INCLUDE /etc/fluent-bit/collectd.conf
This file contains the configuration to use the Collectd data as input for FluentBit. We use the dedicated plugin with the Name field. https://docs.fluentbit.io/manual/pipeline/inputs/collectd
[INPUT]
    Name         collectd
    Tag          collectd
    Listen       0.0.0.0
    Port         25826
    TypesDB          /usr/share/collectd/types.db,/etc/collectd.d/custom-types.db
We add a specific parser to our log file in the parsers.conf file. To check your regexes you can test them with this tool : https://cloud.calyptia.com/regex
[PARSER]
    Name    zeppelin
    Format  regex
    Regex   ^(?<log_level>[^ ]+) \[(?<timestamp>[^\]]+)\] (?<class_name>[^ ]+ [^ ]+) - (?<message>.*)$
    Time_Key    timestamp
    Time_Format %Y-%m-%d %H:%M:%S,%L
    Time_Keep   On
    Time_Offset +0200
